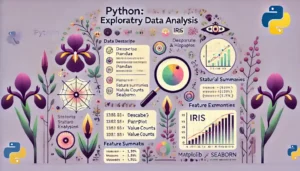
Exploratory Data Analysis (EDA) is a crucial first step in understanding and interpreting datasets, allowing data scientists to detect patterns, spot anomalies, and formulate hypotheses effectively. Mastering EDA techniques enables you to efficiently summarize data characteristics, identify relationships among variables, and prepare datasets for deeper analysis or modeling. In this exercise set, you’ll employ fundamental Pandas operations such as computing summary statistics, analyzing missing data, creating new columns, filtering rows based on conditions, and more.
By systematically exploring the renowned Iris dataset through detailed tasks, you’ll gain practical experience and insight into real-world data scenarios, laying a robust foundation for advanced analytics and machine learning projects.
🚀 Jump Right to Exercise Tasks: Python Exercises – Exploratory Data Analysis
Understanding Your Data with Initial Exploration
Initial exploration involves quickly assessing your dataset’s structure and content. Using Pandas, you can inspect the first few rows, check dataset dimensions, column types, and unique values. This step helps you form a foundational understanding and guides subsequent data cleaning and analysis tasks.
Practical Example
Let’s briefly inspect the structure of a dataset:
import pandas as pd

# Assume df is your loaded DataFrame
print(df.head())
print(df.shape)
print(df.columns)
Example Solution:
(150, 5)
['sepal_length', 'sepal_width', 'petal_length', 'petal_width', 'species']
Key Takeaways:
- Use
df.head()to preview initial data. df.shapereveals dataset dimensions.df.columnsprovides column names for further analysis.
Computing Summary Statistics and Correlations
Calculating descriptive statistics and correlations helps identify central tendencies, variances, and relationships among variables. This step highlights data distributions, potential outliers, and informs feature selection for predictive modeling.
Practical Example
Calculate the mean, median, and correlation between numeric columns:
mean = df['sepal_length'].mean()
median = df['sepal_length'].median()
correlation = df.corr()

print(mean, median)
print(correlation)
Example Solution:
5.843333333333334 5.8
                sepal_length  sepal_width  petal_length  petal_width
sepal_length        1.000000    -0.117570      0.871754     0.817941
sepal_width        -0.117570     1.000000     -0.428440    -0.366126
petal_length        0.871754    -0.428440      1.000000     0.962865
petal_width         0.817941    -0.366126      0.962865     1.000000
Key Takeaways:
- Mean and median summarize central tendency.
- Correlation matrices identify variable relationships.
- These statistics inform subsequent analytical decisions.
Data Cleaning and Column Transformations
Data often requires cleaning and transformation before deeper analysis. Handling missing values, creating new derived columns, and encoding categorical variables ensures datasets are complete and analysis-ready.
Practical Example
Fill missing values and create a derived column:
df['sepal_length'].fillna(df['sepal_length'].mean(), inplace=True)
df['petal_ratio'] = df['petal_length'] / df['sepal_length']
print(df.head())
Example Solution:
   sepal_length  sepal_width  petal_length  petal_width species  petal_ratio
0           5.1          3.5           1.4          0.2  setosa     0.274510
1           4.9          3.0           1.4          0.2  setosa     0.285714
2           4.7          3.2           1.3          0.2  setosa     0.276596
Key Takeaways:
- Fill missing data using column statistics (mean, median).
- Create derived columns to capture relationships.
- Ensure datasets remain clean for accurate analysis.
What You’ll Gain from Completing This Exercise
By completing these exploratory data analysis tasks, you’ll enhance your ability to efficiently summarize, clean, transform, and understand datasets. These essential skills form the backbone of any data-driven workflow, improving your effectiveness in data science and analytics projects.
How to Complete the Exercise Tasks
Use the interactive Python editor provided below each task:
- Write your Python code: Enter solutions into the editor.
- Run your code: Click “Run” to execute your code and view results.
- Check your solution: Validate correctness by using provided tests.
- Reset the editor: Click “Reset” to start fresh.
Earn XP, Unlock Rewards, and Track Progress!
Completing these tasks earns XP, unlocks new levels, unique Avatars and Frames, and enhances your leaderboard ranking. Track your learning progress seamlessly!